Institute of Molecular Genetics of the Czech Academy of Sciences
Why are we interested in the brains of birds, reptiles and fish?
Development of the brain’s processing capacity has traditionally been inferred from data on brain size. However, the similarly large brains of distantly related species can differ in the number and distribution of neurons, their basic computing units.
Neurons are the basic computing units of the brain. Cell types and their connections determine the properties of local circuits that serve area-specific brain functions. There are virtually no data on the quantitative distribution of cell type throughout the brain in most vertebrates outside of some birds and mammals.
Why are birds able to sing?
Birds are remarkably intelligent, although their brains are small. Some parrots are capable of cognitive feats comparable to great apes. The brains of songbirds and parrots contain a very large number of neurons, the density of which greatly exceeds that of mammals. Developmental selection of brain matter leads to corresponding changes in the number of neurons and improves cognitive abilities.
How do we study brains?
Using an isotropic fractionator, we estimated neuronal populations in more than 200 species representing a variety of vertebrates. However, this technique is based on tissue homogenization and therefore does not allow the analysis of the behavior of local brain microcircuits.
The project uses a new whole-brain purification method in combination with light-sheet fluorescence microscopy to assess the total numbers and map the distribution of specific types of neuronal cells in the brains of selected model species representing major avian, reptilian, and fish clades.

High-resolution photomicrograph showing the spatial distribution of dopaminergic neurons and innervations in the brain of Madagascar ground gecko(Paraedura picta). Tyrosine hydroxylase (a molecular marker for dopaminergic neurons) is used here for staining the whole-brain of gecko.
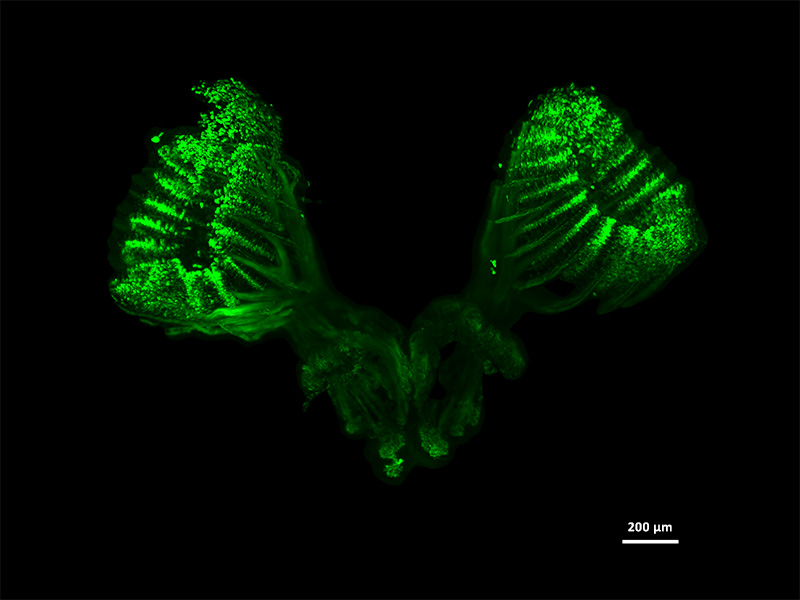
Tissue-specific expression of olfactory receptor genes in the rosettes of adult Zebra fish(Danio rerio). Embryos showing fluorescence in the embryonic olfactory organ were grown to adult stages and fixed. Finally, the olfactory rosettes and the brain of these specimens were dissected, and a 3D reconstruction of the fluorescent organ was performed. The 3D images are obtained using light-sheet fluorescence microscopy.
Look at the animated image.

Neuronal nuclei arrangement in the cerebellum of Zebra Finch (Taeniopygia guttata). Cerebellum have the highest neuronal density compared to other regions of the brain and these neurons are closely packed in the form of a tubular structure. The 3D images are obtained using light-sheet fluorescence microscopy.

Whole-mount immunolabeling of neurons and dopaminergic neuronal markers (Tyrosine hydroxylase & Dopamine beta-hydroxylase) in the right brain hemisphere of Zebra finch (Taeniopygia guttata). The 3D images are obtained using light-sheet fluorescence microscopy.

Expanded mouse brain slices were triple-stained, with immunolabeling targeting the neuronal marker, the inhibitory neuronal marker (calbindin 1), and DAPI for all nuclei. These labels were applied to the expanded half brain slice of the mouse (Mus musculus), with slice thickness ranging from 300-400 µm. Three-dimensional images were captured utilizing expansion light-sheet fluorescence microscopy.
Photo author: Rahul Avaroth Bhaskaran, Faculty of Science, UK
Edited by: Eliška Koňaříková, Institute of Molecular Genetics of the Czech Academy of Sciences (IMG)
Created in cooperation with the Light Microscopy Core Facility, IMG.
A list of all exhibitions within the 25th edition of the festival can be found on the website www.tydenmozku.cz (in Czech).